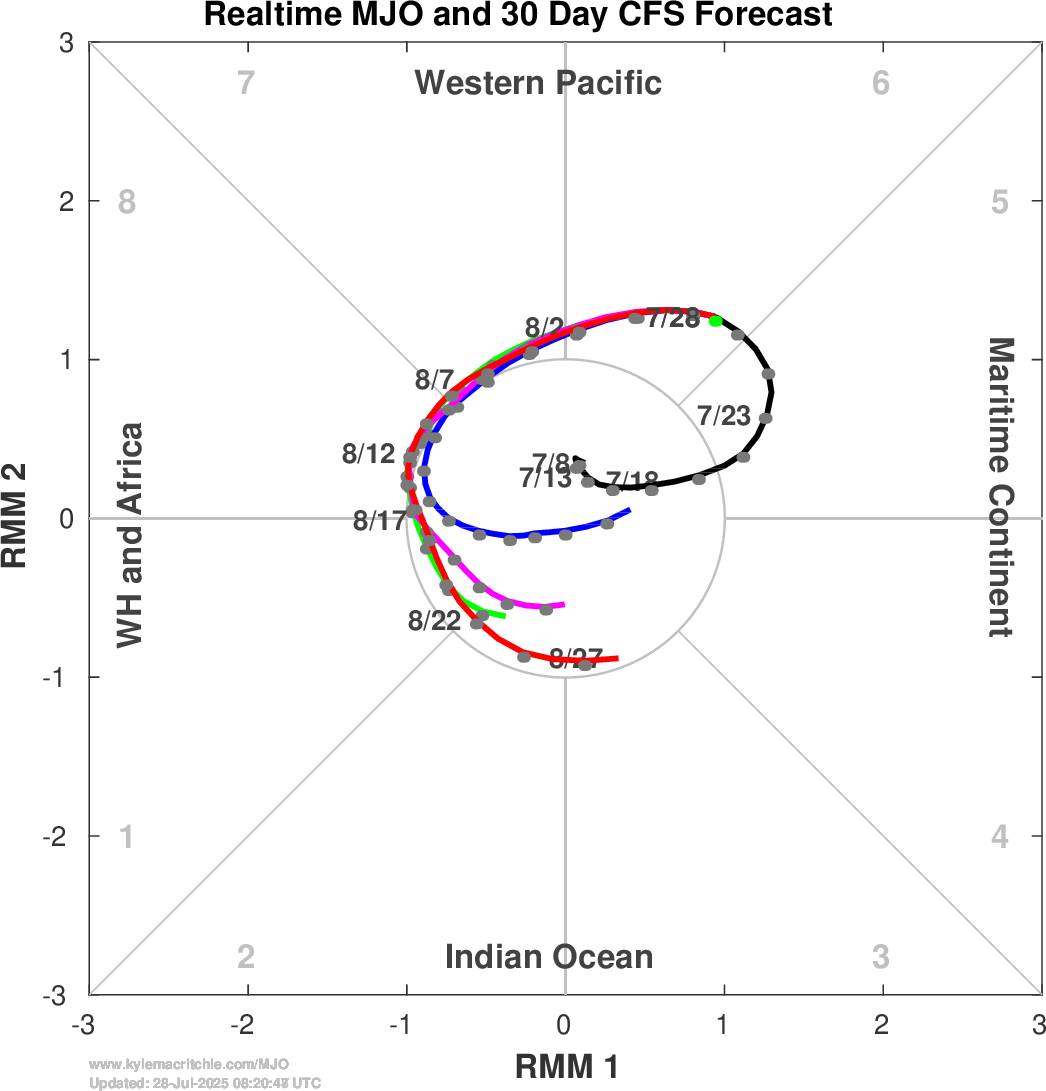
The black line shows the last 20 days of MJO activity, and the colored lines are the 4 ensemble members. Click image for full size.
This is not the regular RMM index. See the information at the bottom of the Map Help page for more.